Dashboard
Faraday's Dashboard contains a summary of all data within a Workspace. Each box is a visualization for an specific aspect of the collected information.
When you create a new Workspace an empty dashboard will look as below
![]()
Once you start adding data by importing scans, running tools, etc, it will be like this
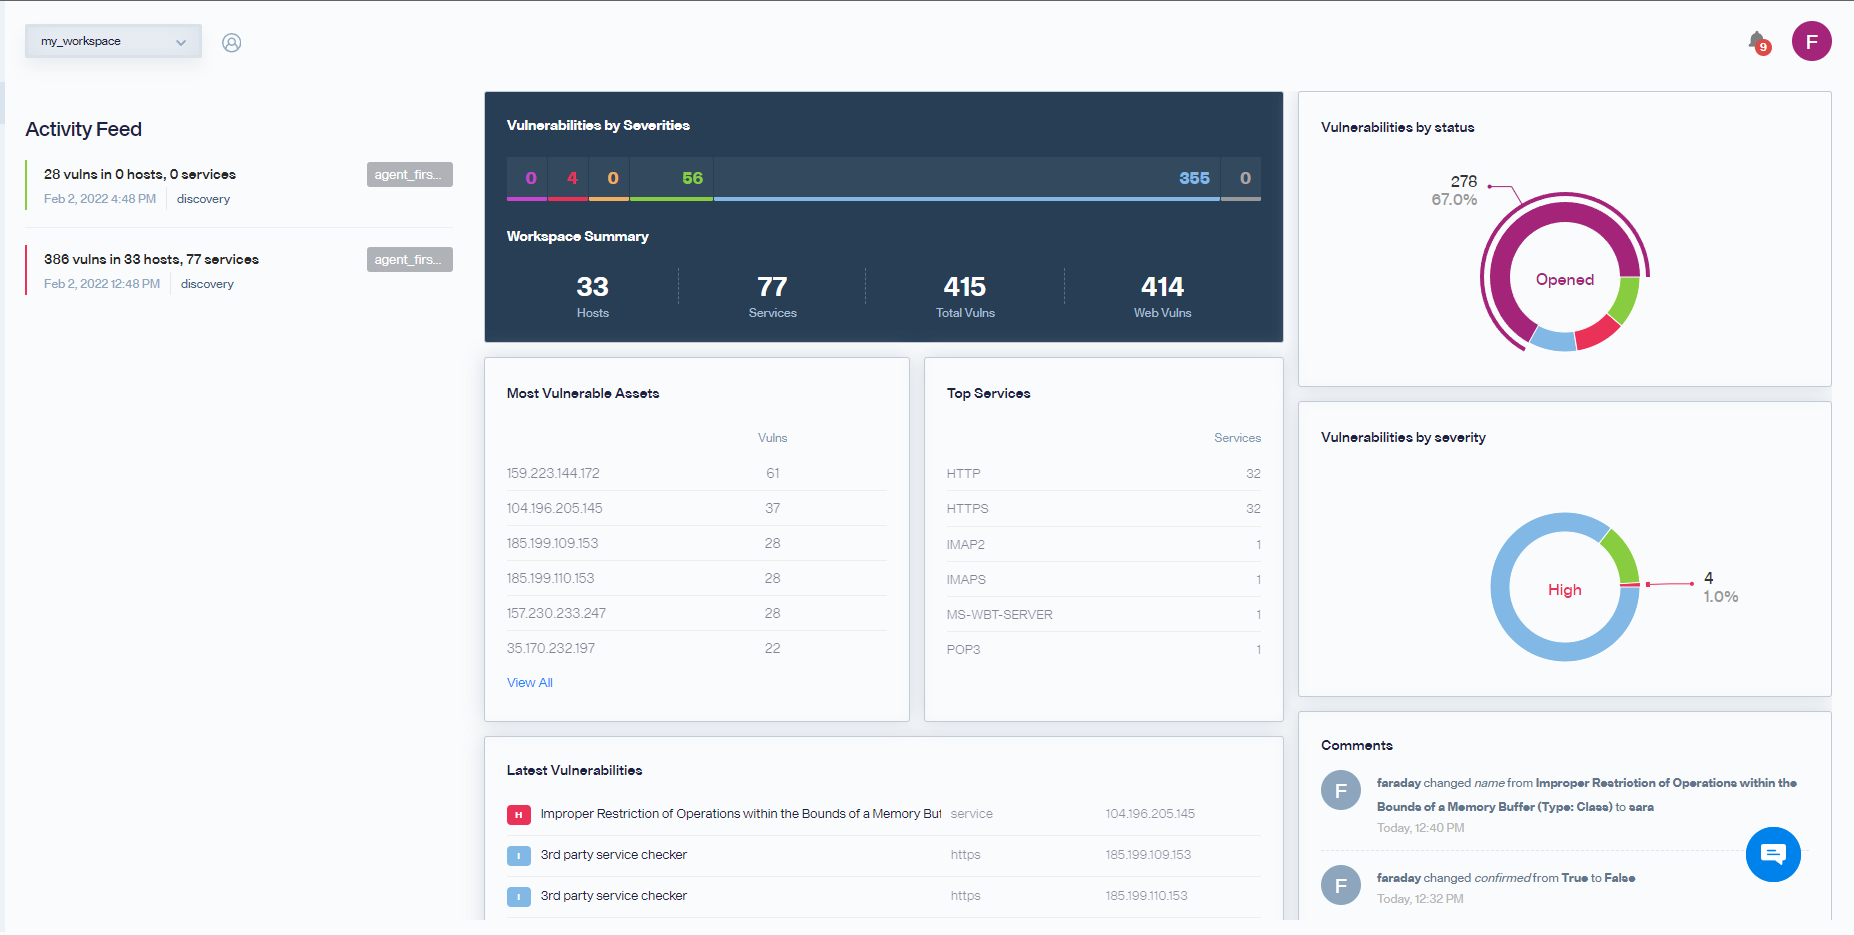
Let's see in more detail the functionality and information displayed in the dashboard
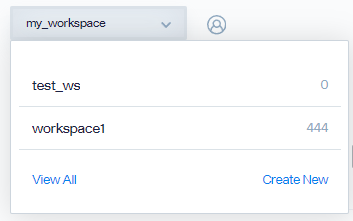
Switching Workspaces
Top left corner next to F you can see the current Workspace, click on it and a drop-list will be displayed to switch between Workspace quickly
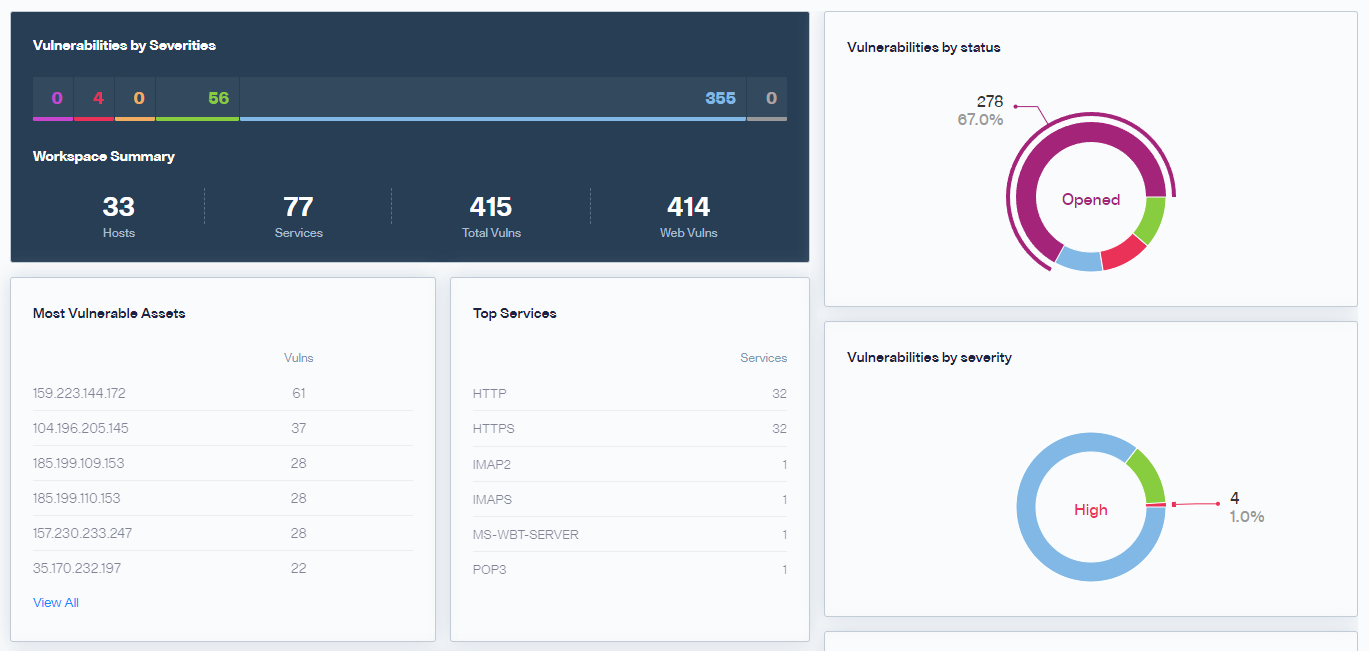
Progress and Vulnerabilities Distribution/Counters
Percentage of time spend using Workspace settings (start/end date)
and pie charts for vulnerabilies by Severity and Status also total counters
of vulnerabilities by Severity included
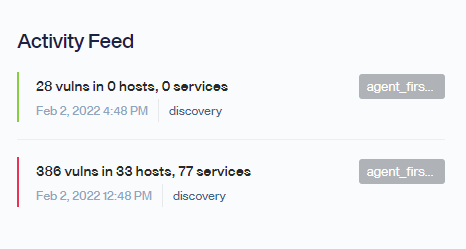
Activity Feed
Users and actions with results performed on the workspace for quickly seeing the progress been made on the workspace
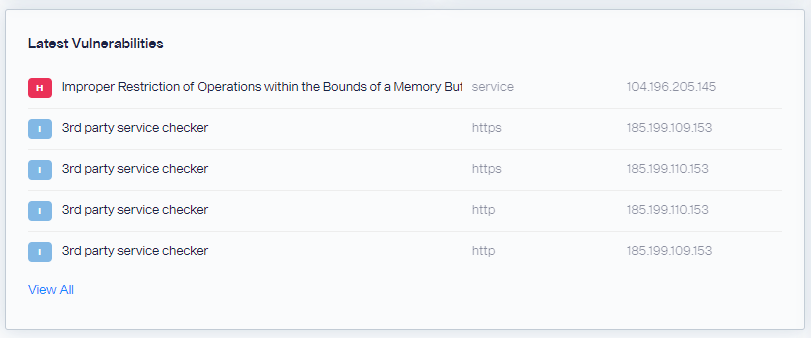
Last Vulnerabilities
Quick list of latest vulnerabilities added into the workspace
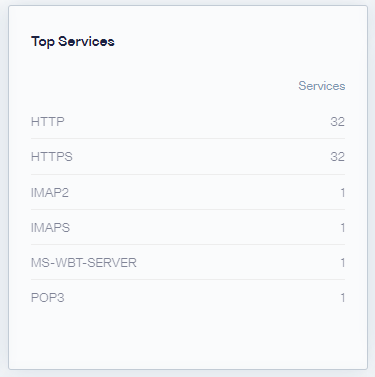
Service Report
A counter view of Services found in the workspace
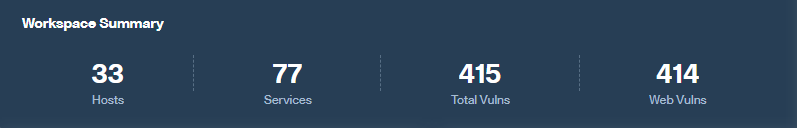
Workspace Summary
An overall summary of Hosts, Services and Vulnerabilties found so far
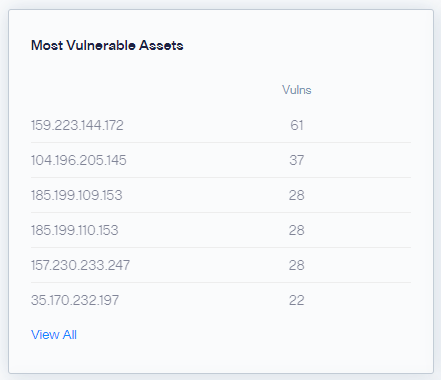
Hosts
List of Assets and Vulnerabilities currently in the workspace.
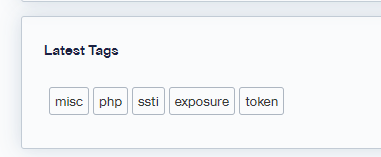
Tags
View of the recent used tags.