Executive Reports (HTML)
Faraday's report builder lets you create fully customized, HTML-based executive reports that combine vulnerability data, charts, asset lists, and free-form text into a single branded document. Reports are generated in HTML and can be downloaded as PDF directly from the Reports list.
This is an improved and more flexible version of the previous report generation feature. The new builder generates a single HTML report that can then be exported to PDF, and does not support DOCX output.
Legacy Reports: During the transition period, the previous report generation experience remains accessible via the Legacy Reports tab in the Reports section.
Getting Started
Navigate to Reports in the left sidebar. Your report list opens on the My Reports tab, where all previously generated reports are displayed.
Step 1 – Create a New Report
Click + Create New Report. A dropdown menu offers two options:
- Choose a Template — opens the Templates tab so you can select which template to use as the base for your report.
- Use Default Template — skips template selection and takes you directly to the scope configuration step. The report will be built on top of the default template.
Tip: If you have HTML templates already saved (visible under My Templates on the Templates tab), selecting one from there is the fastest way to reuse a layout.
Step 2 – Configure the Scope
The Create Report – Configure Scope screen lets you define which data the report will draw from.
Select Workspaces
Check one or more workspaces from the left-hand list. The asset panel on the right updates automatically to show all assets belonging to your selection.
Select Assets
Assets are selected by default when you pick a workspace. You can deselect individual assets to narrow the scope. A summary badge at the top (e.g., 2 Workspaces > 10 Assets > 1865 Vulnerabilities) updates in real time.
Filter Vulnerabilities (optional)
Use the filter bar at the bottom to add conditions before including vulnerabilities in the report. For example:
Confirmed = True— includes only confirmed vulnerabilities.
After setting the filters, click Apply Filter(s) to Context. The badge reflects the filtered count (e.g., 1 filtered = 13 Vulnerabilities).
You can also enable Group by Name to aggregate duplicate vulnerability names across assets.
Click Next to proceed to the report builder. To do so, the scope must include at least one workspace and one asset with vulnerabilities. If this requirement is not met, the following message will be displayed:
"Complete all required fields before continuing: add at least one workspace and one asset with vulnerabilities to the report scope."
Step 3 – Build the Report
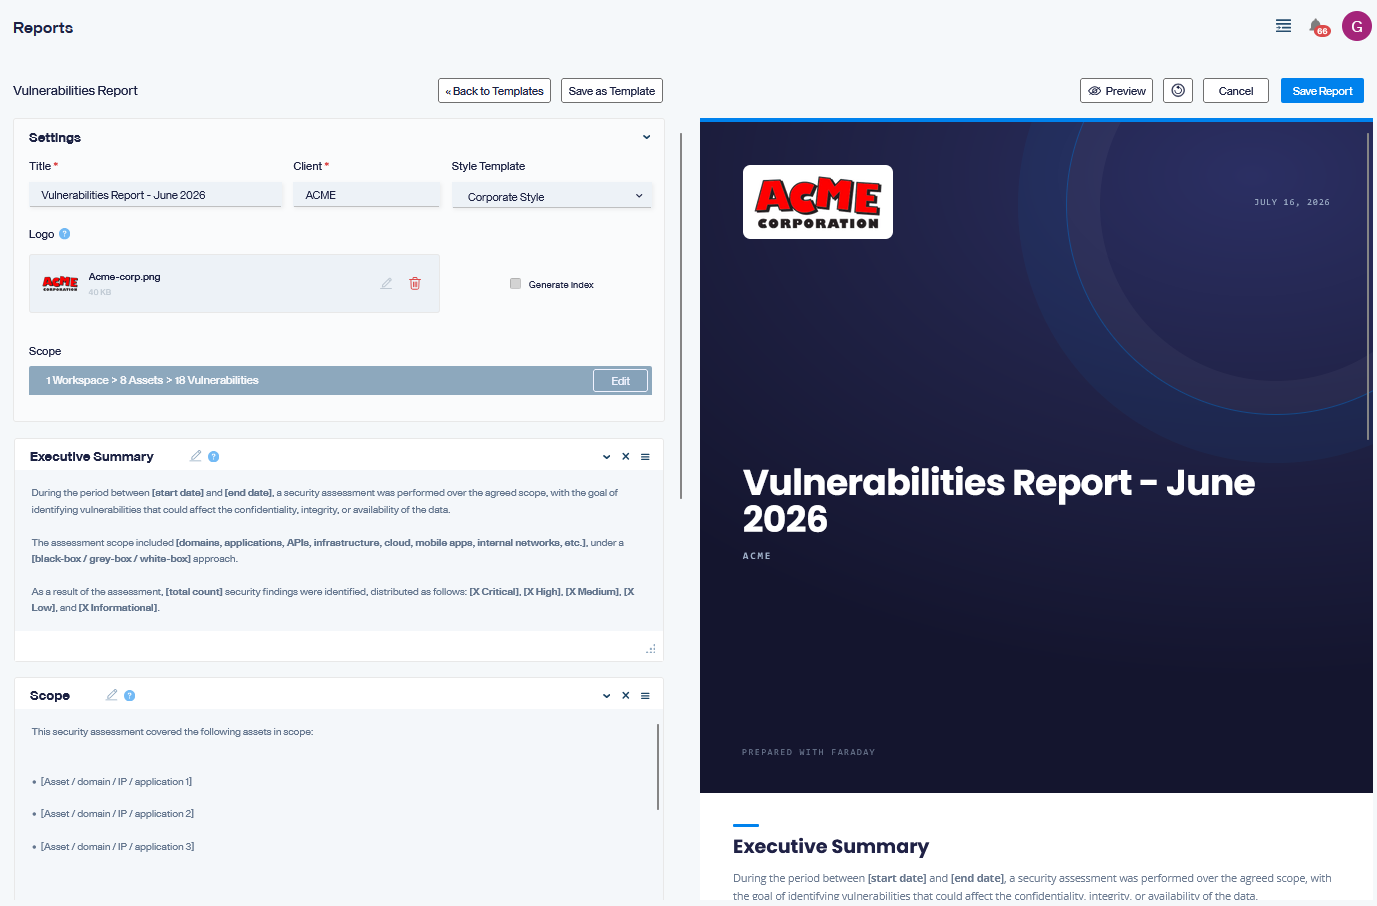
The report builder has two panels: the configuration panel on the left and a preview panel on the right.
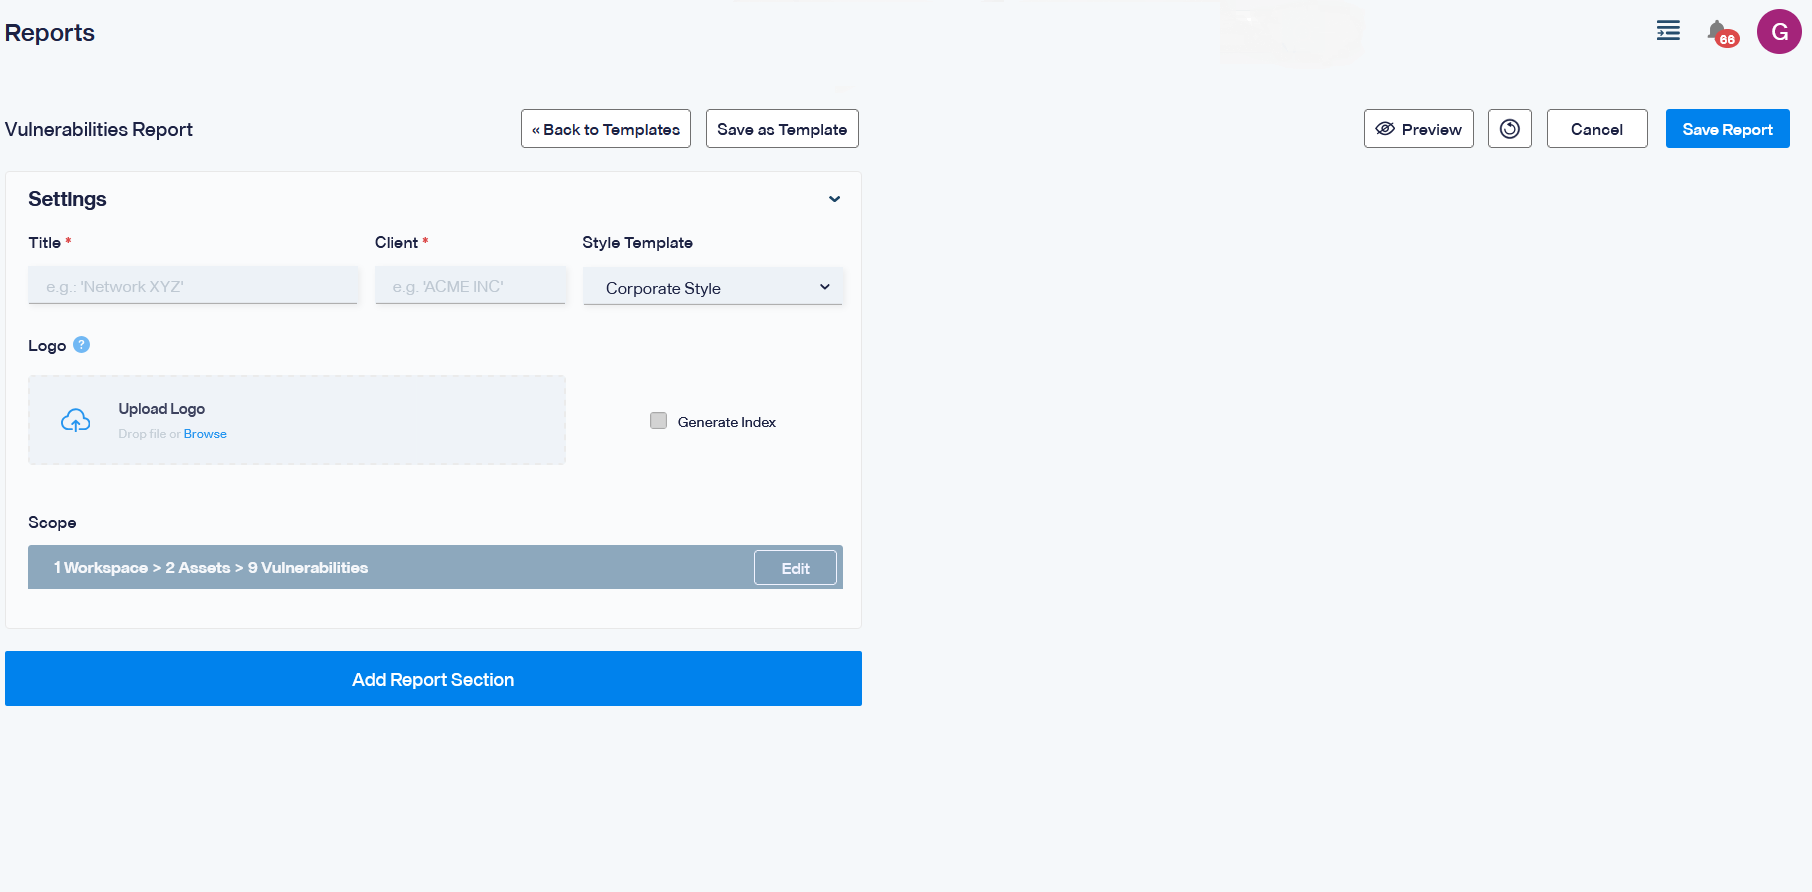
Settings
Title and Client are the only required fields — the report cannot be saved without them. The value entered in Title will also be used as the report's name in the My Reports list.
| Field | Required | Description |
|---|---|---|
| Title | Yes | The report's name and main heading (e.g., June Vulnerabilities). |
| Client | Yes | The client or organization name that appears on the cover. |
| Style Template | No | CSS theme that controls fonts, colors, and layout. Cannot be left empty, but reports using the Default Template come with Corporate Style preselected — you can change it if needed. |
| Generate Index | No | Toggle on to automatically add a table of contents page listing all sections. |
| Logo | No | Upload a logo image (drag-and-drop or Browse). Its position in the report is determined by the selected template. |
The Scope field shows the scope you configured in the previous step. Click Edit to go back and modify it.
Preview Panel
Click Preview (top-right) to open or close the preview panel. The preview is not live — it only updates when you click the ⟳ refresh button.
The preview renders a reduced version of the report: sections that include vulnerability or asset data will display a maximum of 3 items, regardless of how many are included in the actual scope. The final saved report will always contain the full dataset.
The first time you click ⟳, a notice will appear reminding you that the preview reflects only up to 3 vulnerabilities per section. Dismiss it to continue.
Step 4 – Add Report Section
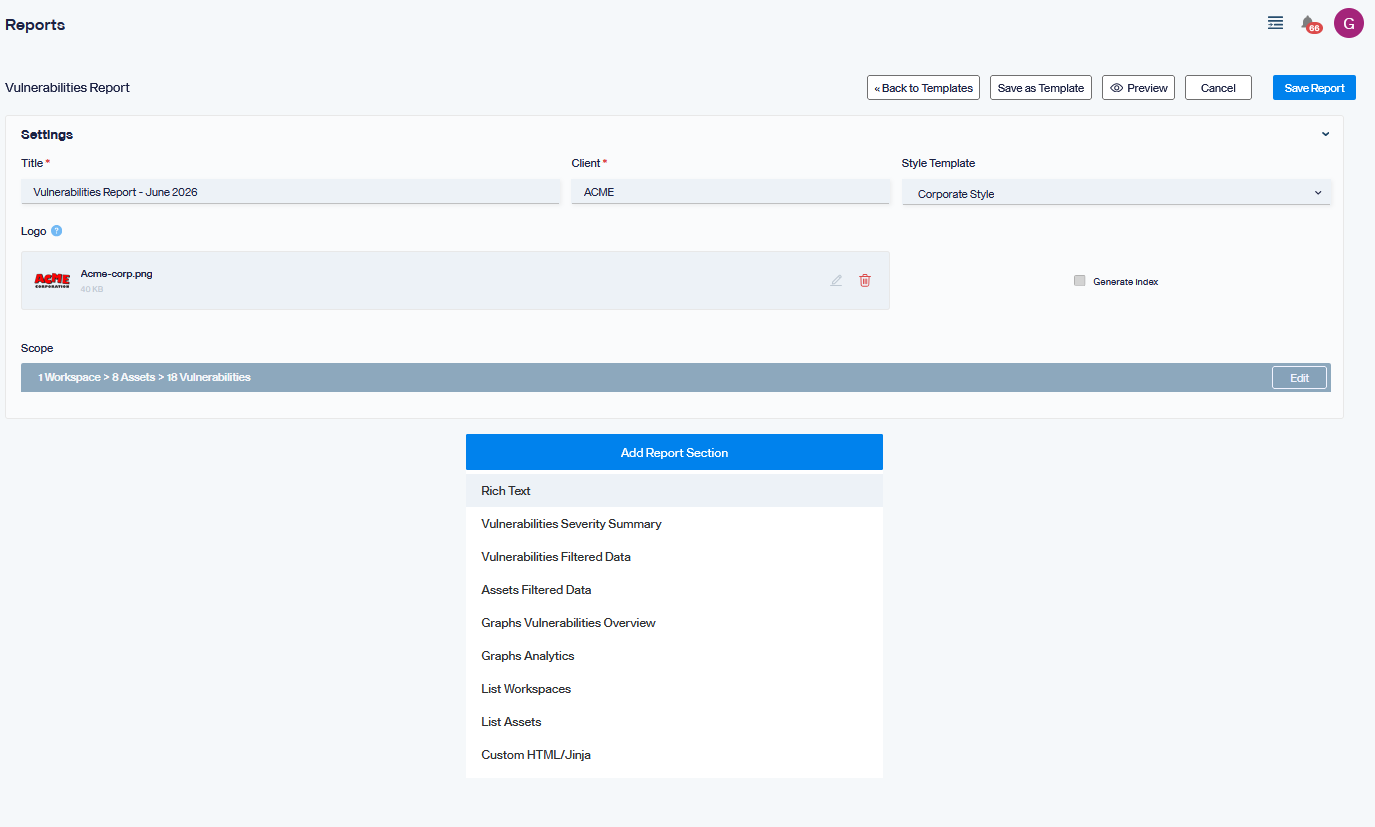
Click + Add Report Section to insert a new section below the current one. The available section types depend on whether Group by Name was enabled in Step 2.
| Section | Available when | Description |
|---|---|---|
| Rich Text | Always | Free-form text block with rich-text formatting. |
| Vulnerabilities Severity Summary | Always | Vulnerability counts grouped by severity. |
| Vulnerabilities Filtered Data | Group by Name disabled | Detailed data for selected vulnerabilities and their attributes. |
| Grouped Vulnerabilities Filtered Data | Group by Name enabled | Detailed data for grouped vulnerabilities, with main and per-occurrence attributes. |
| Assets Filtered Data | Always | Detailed data for selected assets and their attributes. |
| Graphs Vulnerabilities Overview | Always | Up to 4 pie charts with a visual overview of vulnerability data. |
| Graphs Analytics | Always | Charts created in Faraday's Analytics module. |
| List Workspaces | Always | List of workspaces included in the scope. |
| List Assets | Always | List of assets included in the scope. |
| Custom HTML/Jinja | Always | Custom HTML block with optional Jinja templating to access scope data. |
Each section card has controls in the top-right corner:
- ∨ / ∧ — collapse or expand the block.
- ✕ — remove the section.
- ≡ — drag handle to reorder sections.
- ✏ — rename the section heading.
Rich Text
A free-form text block. Supports bold, italic, inline code, code blocks, blockquotes, tables, and hyperlinks via a rich-text toolbar.
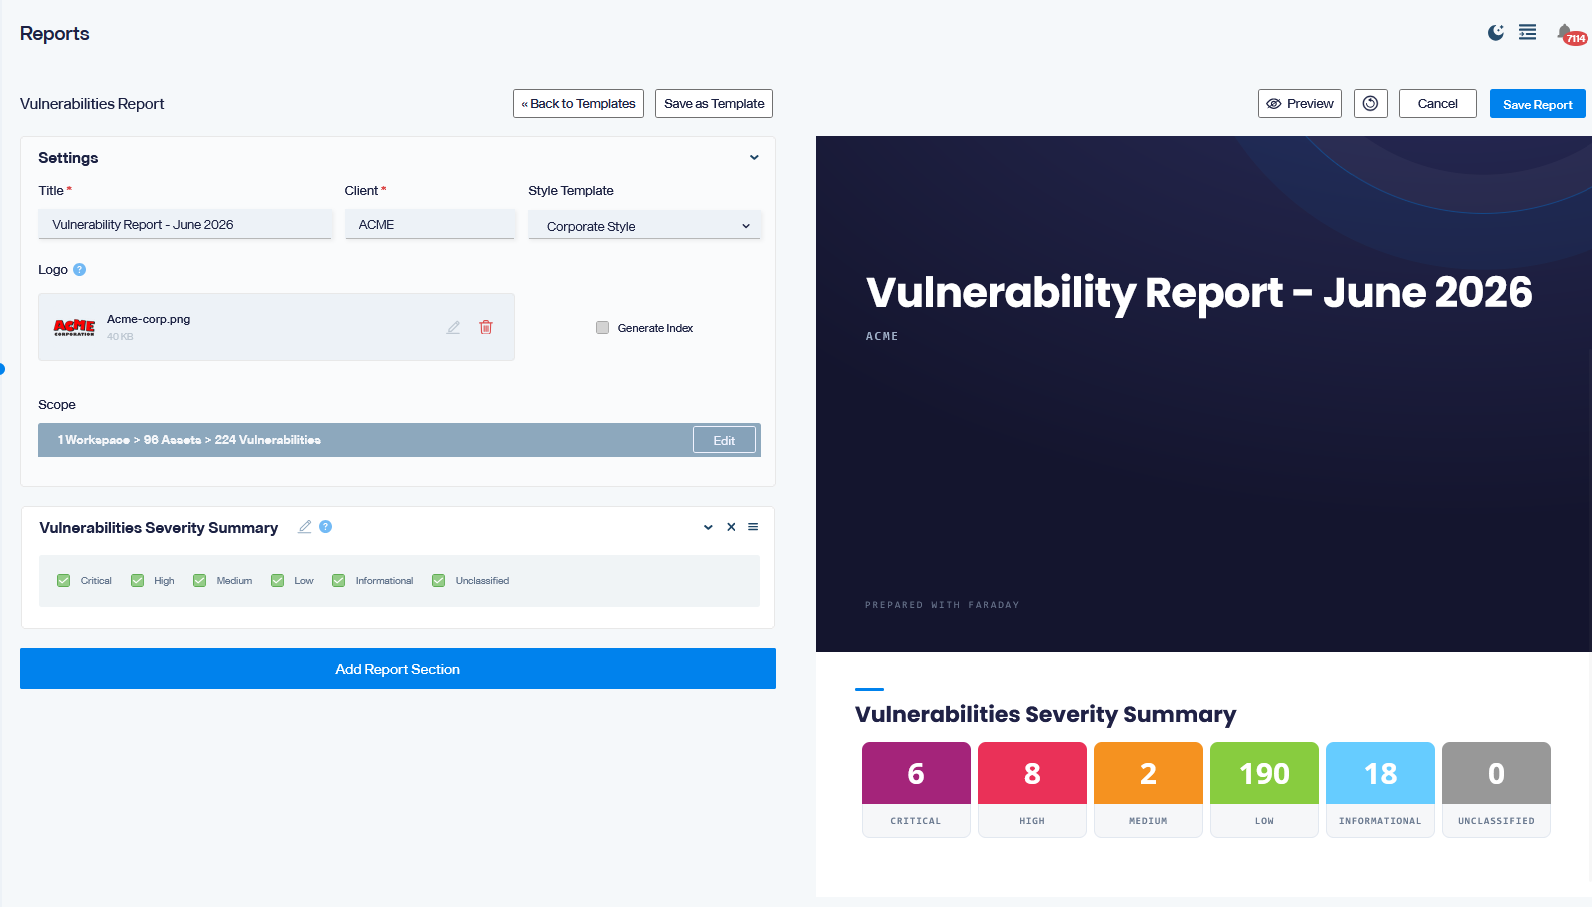
Vulnerabilities Severity Summary
Displays vulnerability counts grouped by severity level. Select which severities to include: Critical, High, Medium, Low, Informational, and Unclassified.
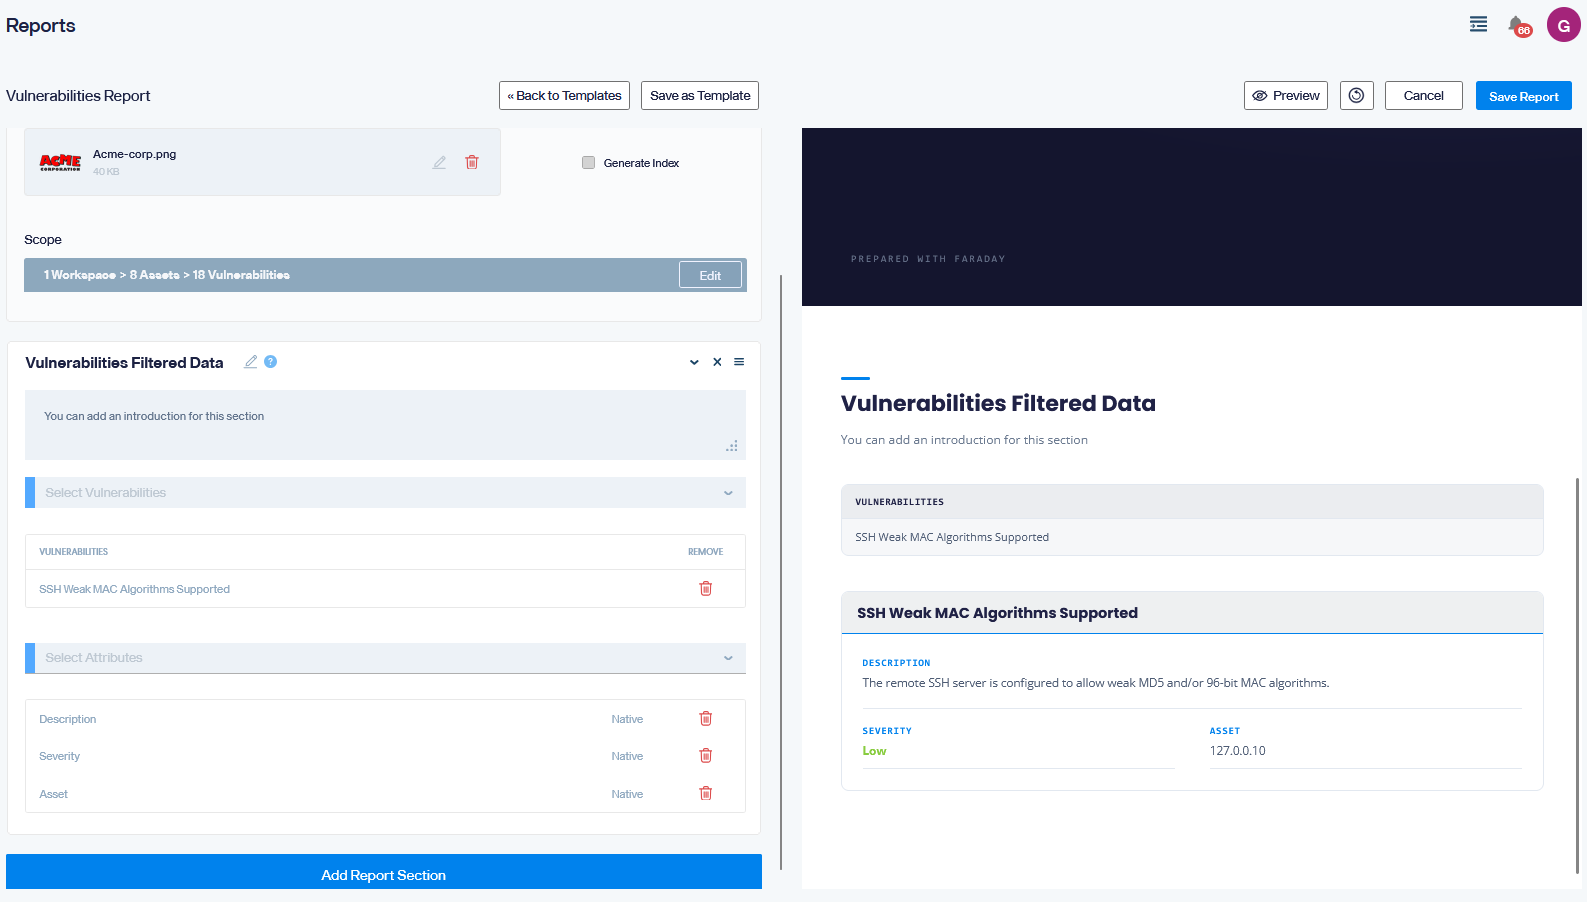
Vulnerabilities Filtered Data
(Only available when Group by Name is disabled)
Select which vulnerabilities to include from a dropdown list (you can select all or individual ones, and search by name). Then select the attributes to display for each vulnerability (e.g., Description, Severity, Total Risk Score). The rendered section shows a list of the selected vulnerability names followed by an individual table for each one containing the chosen attributes. An optional introductory text field is available at the top of the section.
Grouped Vulnerabilities Filtered Data
(Only available when Group by Name is enabled)
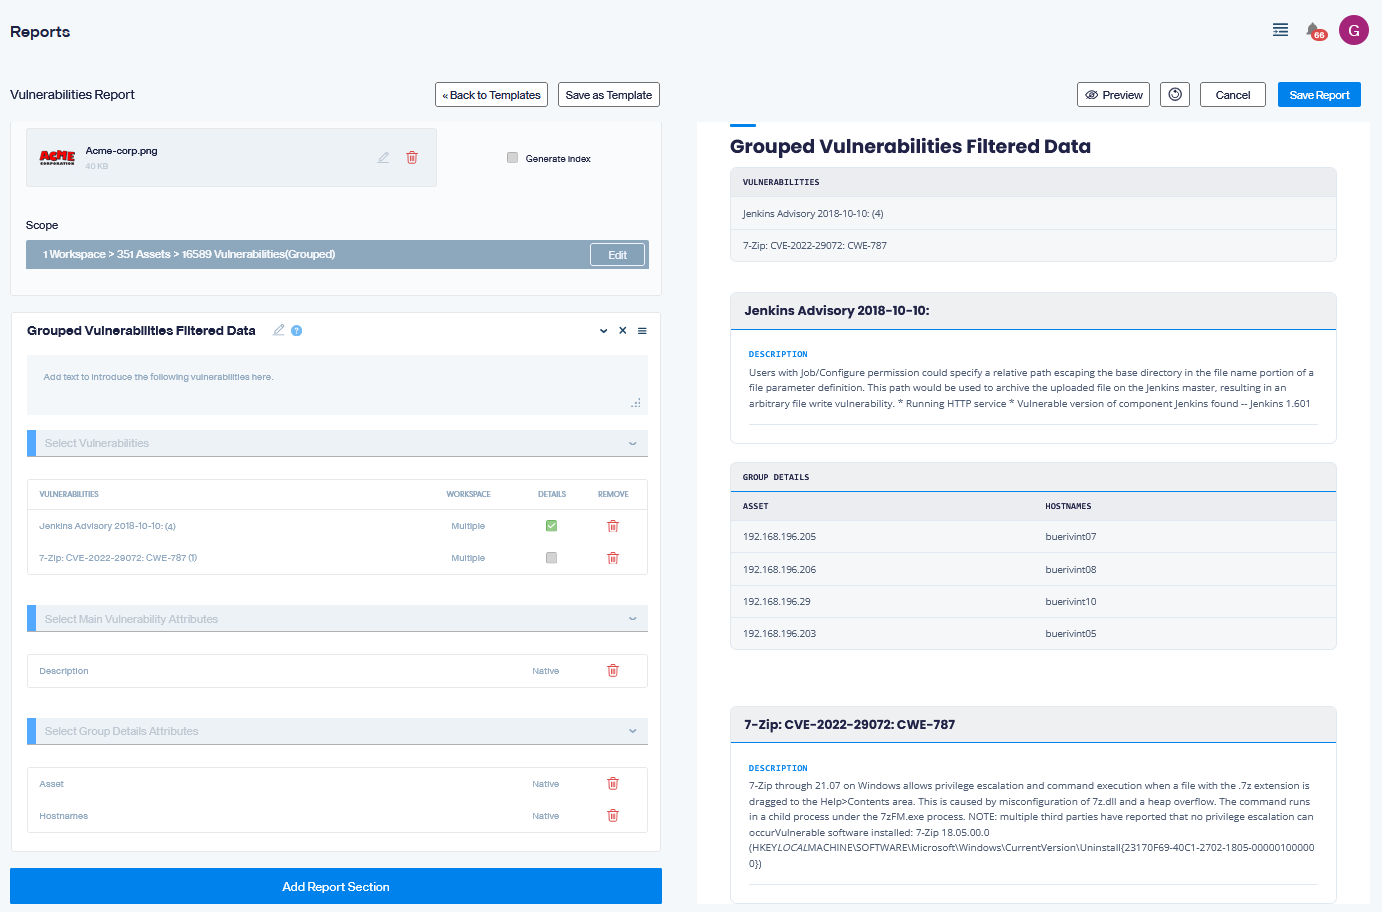
Similar to Vulnerabilities Filtered Data but adapted for grouped vulnerabilities. Since each vulnerability name may appear across multiple assets, this section has three selectors:
- Select Vulnerabilities — choose which grouped vulnerability names to include. Each entry shows the total number of occurrences across assets.
- Select Main Vulnerability Attributes — attributes shown once per vulnerability group (e.g., Description).
- Select Group Details Attributes — attributes shown per individual occurrence within the group (e.g., Asset).
For each selected vulnerability, you can also toggle the Details checkbox to control whether per-occurrence detail is shown. The rendered section displays a list of selected vulnerability names, followed by a table for each one showing the main attributes and, if enabled, a breakdown of each individual occurrence with the group detail attributes. An optional introductory text field is available at the top of the section.
Assets Filtered Data
Select which assets to include from a dropdown list (you can select all or individual ones, and search by name). Then select the attributes to display for each asset (e.g., Risk Score, Vulnerabilities, Description). The rendered section shows a list of the selected asset names followed by an individual table for each one containing the chosen attributes. An optional introductory text field is available at the top of the section.
Graphs Vulnerabilities Overview
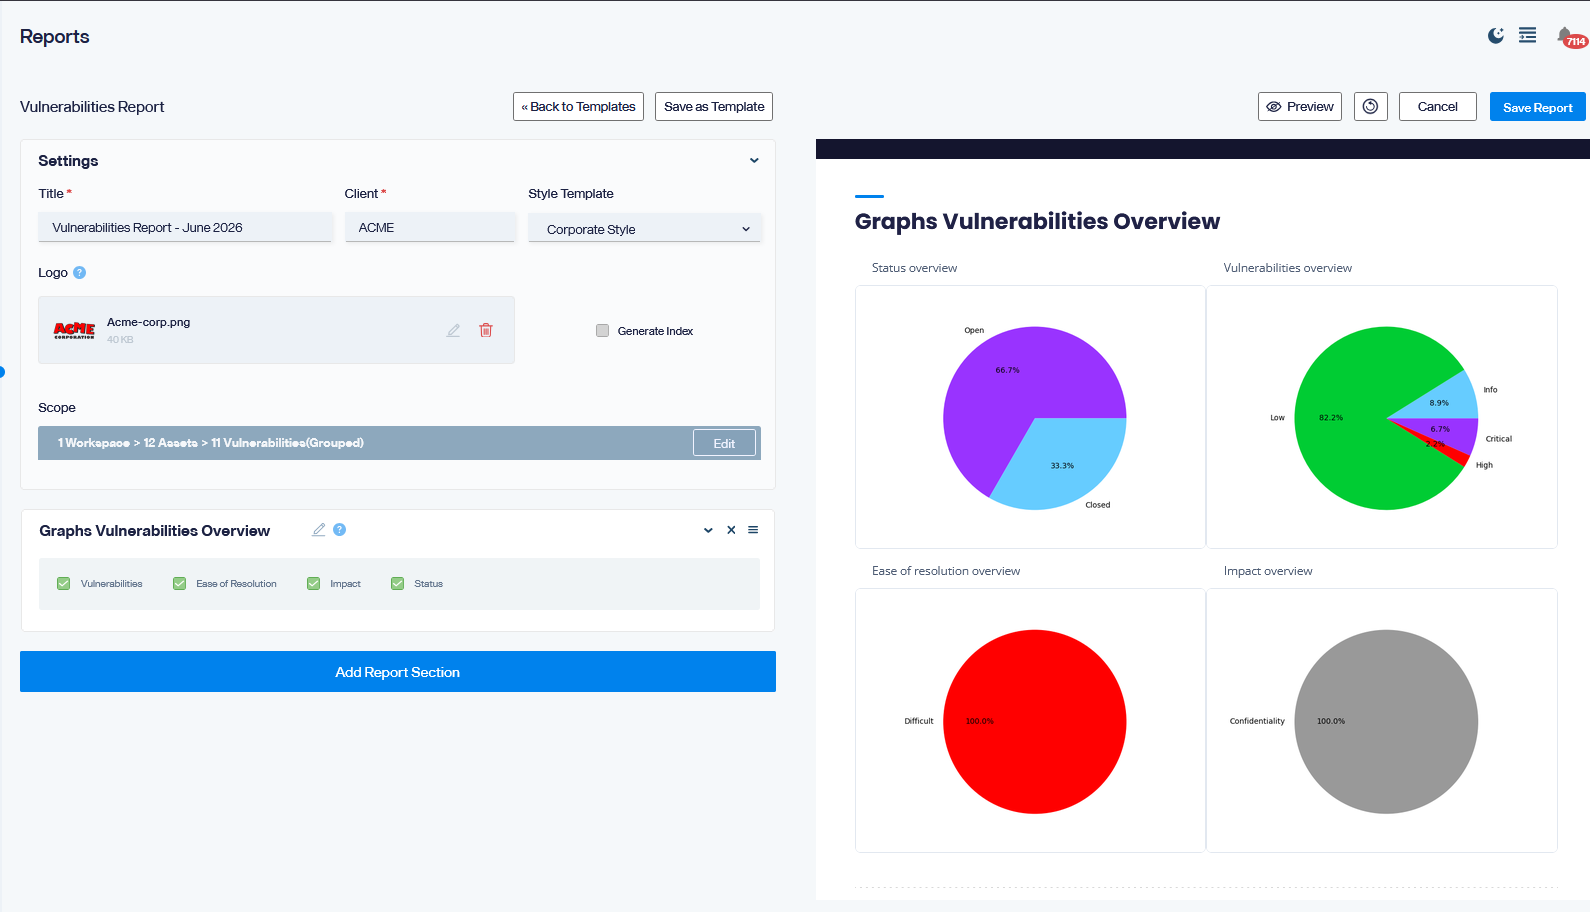
Renders up to 4 pie charts providing a visual overview of vulnerability data. Select which charts to include: Vulnerabilities (breakdown by severity), Ease of Resolution, Impact, and Status. If a selected chart cannot be generated due to insufficient data in the scope, a warning message will indicate which ones were skipped.
Graphs Analytics
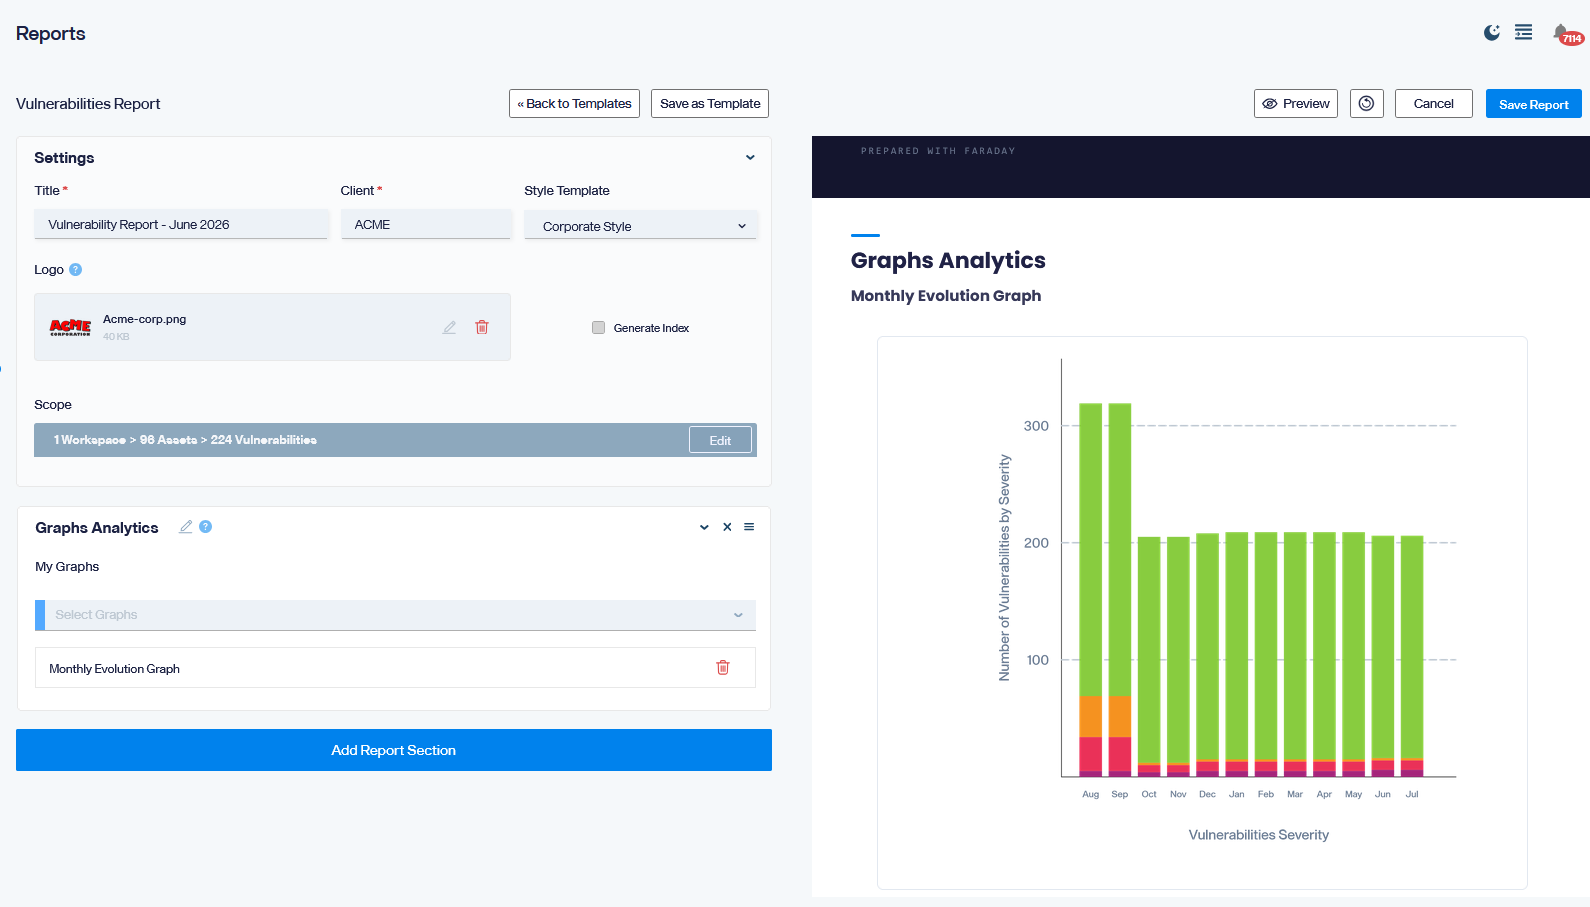
Includes charts created in Faraday's Analytics module. Select one or more saved graphs from the My Graphs dropdown to embed them in the report. Graphs must be created in Analytics beforehand.
List Workspaces
Displays a list of the workspaces included in the report scope.
List Assets
Displays a list of the assets included in the report scope.
Custom HTML/Jinja
A free-form code block where you can write custom HTML to include in the report. Within this block you can also use Jinja templating syntax to dynamically access scope data such as vulnerabilities, assets, and other report context. This section is intended for advanced users who need content or layouts beyond what the built-in section types provide.
Step 5 – Save or Export
When you're done configuring the report:
- Save Report — saves the report to My Reports and generates the full HTML output with all data.
- Save as Template — saves the current layout (sections and settings, without specific scope data) as a reusable template under My Templates.
- Cancel — discards changes and returns to the Reports list.
Once saved, the report appears at the top of the My Reports list.
Managing Reports
From the My Reports list, select one or more reports to enable the action toolbar. The available actions are:
- Clone and update — creates a new report based on the selected one, using the same template and scope configuration but with refreshed data. This is useful for recurring reports: instead of building a new report from scratch each time, you can use a previous report as the base and click Clone and update to generate an updated version that reflects the current state of the original scope (e.g., if vulnerabilities that were previously confirmed are no longer so, the new report will reflect that change).
- Edit & Update — opens the selected report in the builder to make changes. Saving will overwrite the existing report.
- Download — downloads the selected report. The dropdown offers three format options: PDF Document (.pdf), Comma-separated values (.csv) (exports the report's scope data — vulnerabilities and their attributes — as a CSV file), and HTML Document (.html).
- Delete — permanently deletes the selected report(s).
Tips
- Styles tab — manage and upload custom CSS themes to match your organization's branding.
- The preview is a draft: it loads up to 3 items per data block. Always save to get the complete report.
- You can save the same layout as a template and reuse it for recurring reports (e.g., monthly executive summaries) by updating only the scope each time.